.png)
There are many moving pieces when managing a single hackathon, and even more when . When we were creating a dashboard for groups that produce , we accounted for the type of statistics an organizer would be interest in.
When hackathons occur, organizers like to learn from previous hackathons to determine what could be improved. In order to conduct that kind of analysis, there should be access to a specific set of information regarding the attendees, teams, and planning process (tasking, budgeting, recruiting, marketing). Below is a description of all areas of reporting and statistics that we provide.
Create your hack series now
On the dashboard, we have prepared three sections of reports. The first one is for our one-click reports. The second is for the high-level , and the third setion covers financial information for the hackathons.
One-Click Reports
On your dashboard, this button will generate an html-style word doc with detailed information on the challenges assigned across all of your events, a list of teams that have hacked at your events, attendees that have participated in your events, an overview which tasks were involved in the hackathon and the relatvie completion rate. These are some of the typical elements of a hackathon for which organizers include in reports.
This button will generate an excel spreadsheet with a breakdown of all attendee information, team information, sponsor information, and hackathon outcomes information. From this spreadsheet, you can see how many people attended, how many hacked, what skills each person had, and contact information for each person and team. You can edit this spreadsheet.
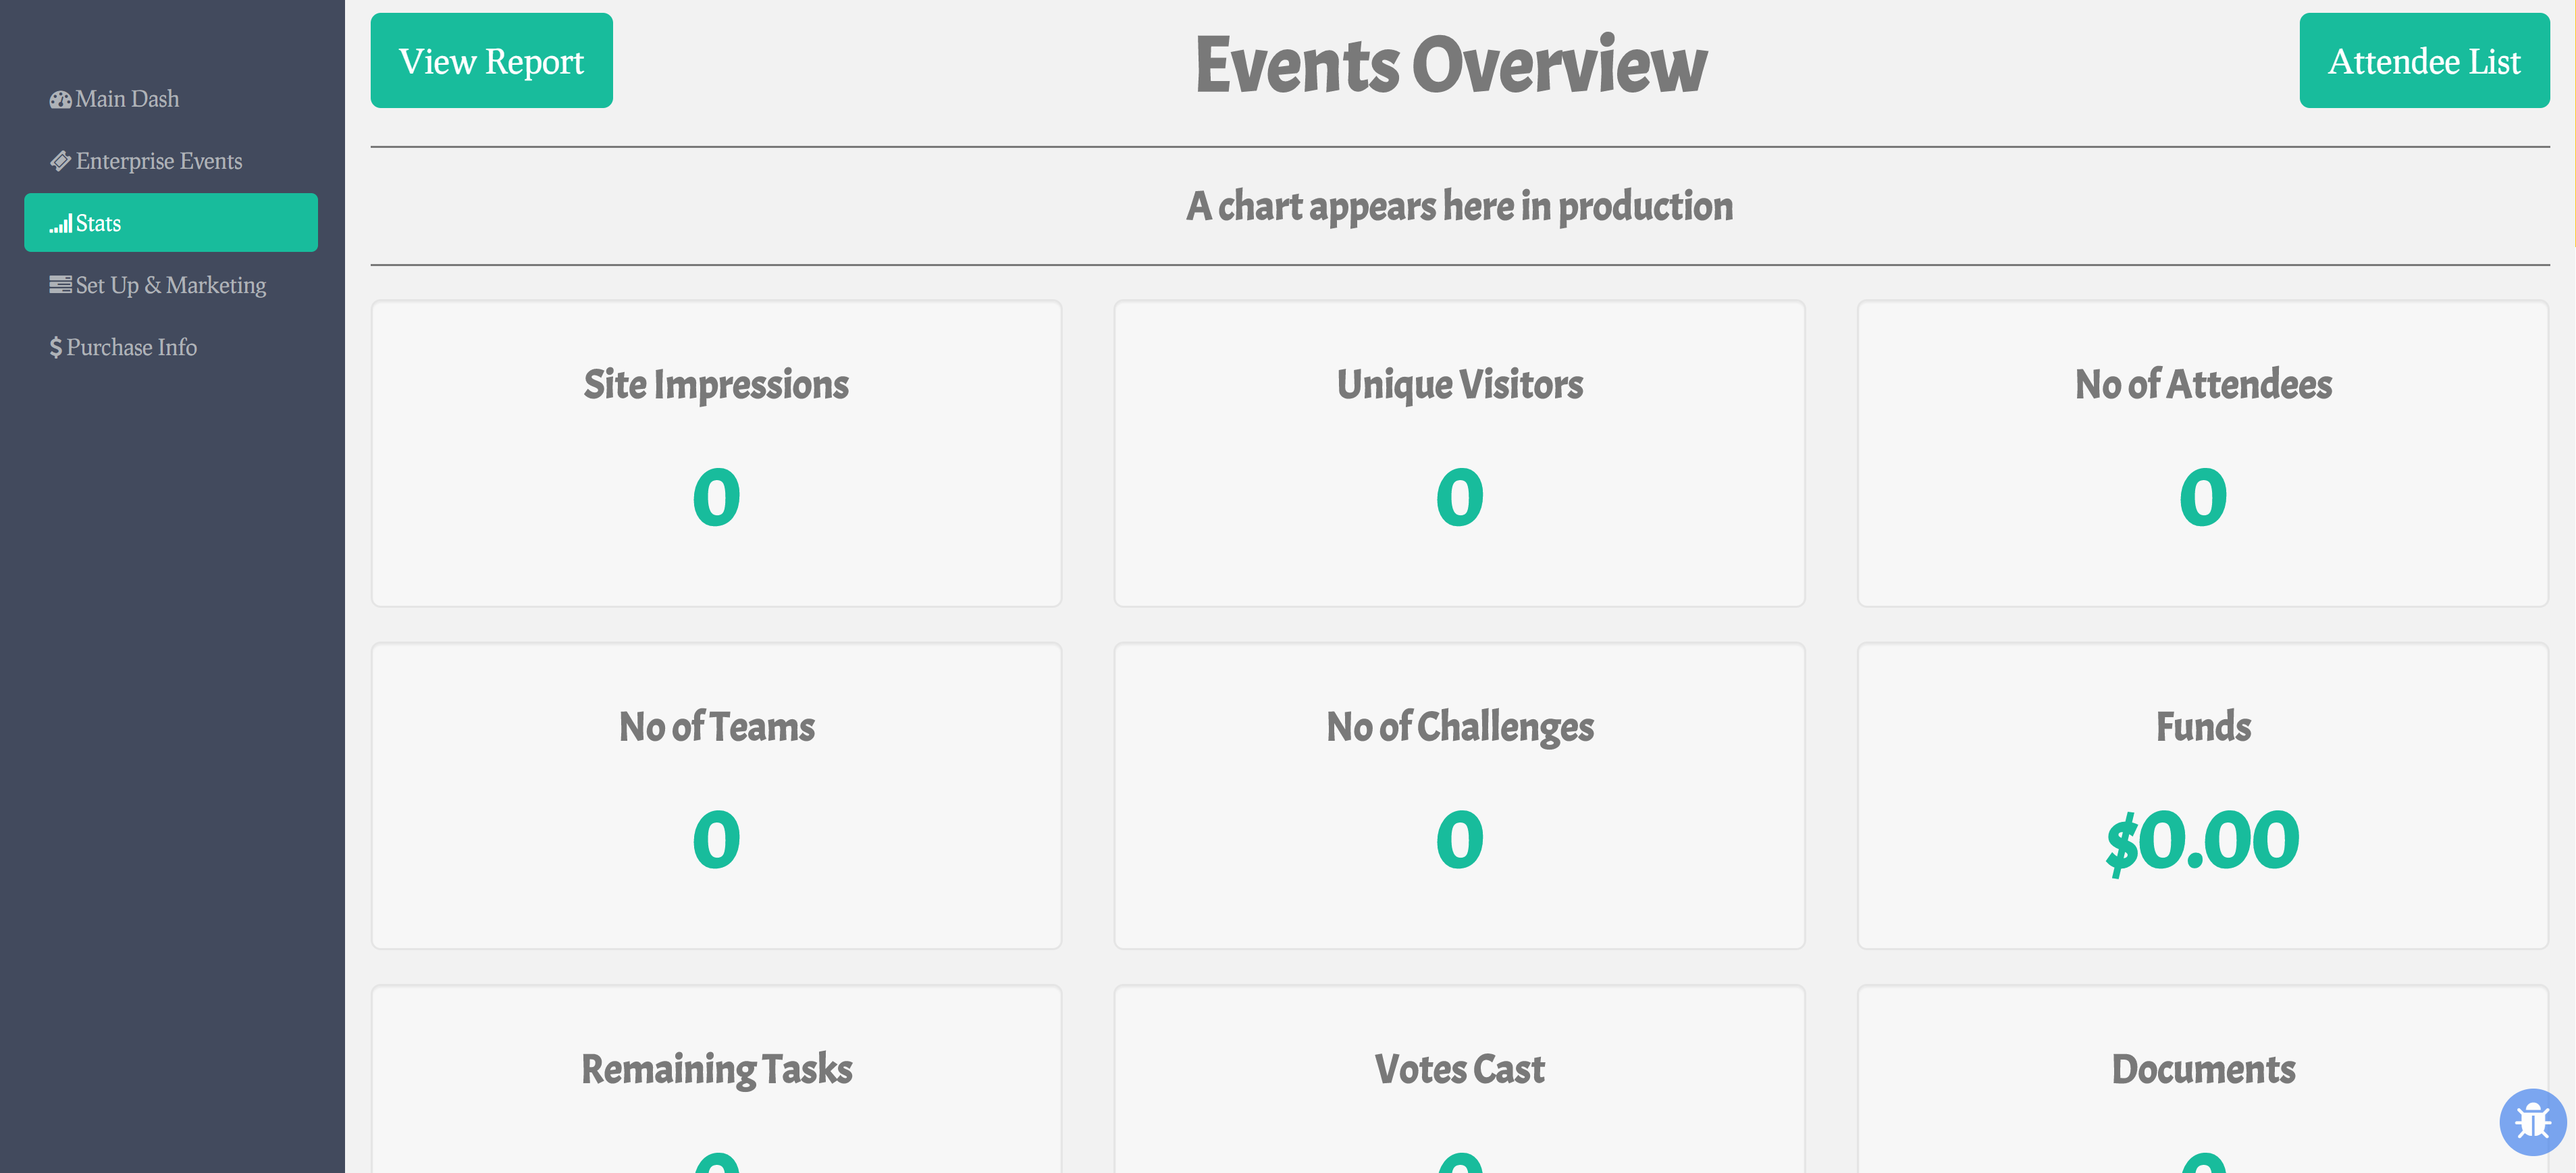
High-Level Statistics
Under high-level statistics, we show a view of all event stats combined. In one view, you can see the following:
These high level stats can assist when seeing which marketing campaigns are working the best and how well each of your events are doing in terms of engagement and planning.
Financial Statistics
Lastly, this section shows a series of graphs to help interpret how the hackathons are doing fincnacially. This section shows the following: